Dashboards
Dashboards can be accessed from the feature on the left-hand menu of Cim50 and provide key performance indicators across the Cim50 Modules.
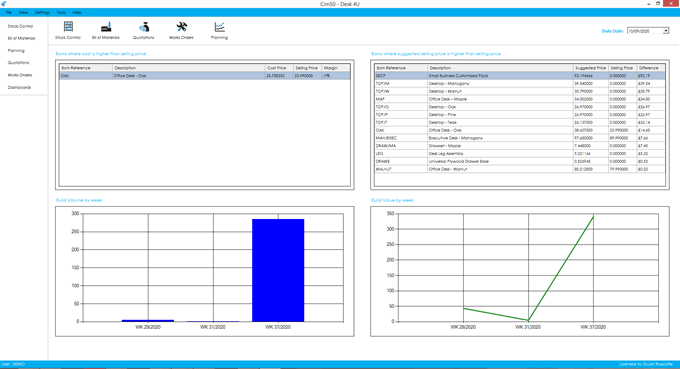
There are 4 dashboards available for Bill of Materials. Details on each dashboard can be found below.
To provide efficiency in the Dashboard functionality, the Dashboard data is refreshed nightly by the CIMi service running on the server during the Check Data routine. You can also manually refresh data at any time by going to File > Maintenance > Refresh Dashboard Data, selecting all Dashboards, or those required.
The Dashboards included for BOM are as follows:
Cost is higher than selling price
This dashboard gives you a list of BOM items that have a calculated unit cost higher than the selling price specified on the associated stock record.
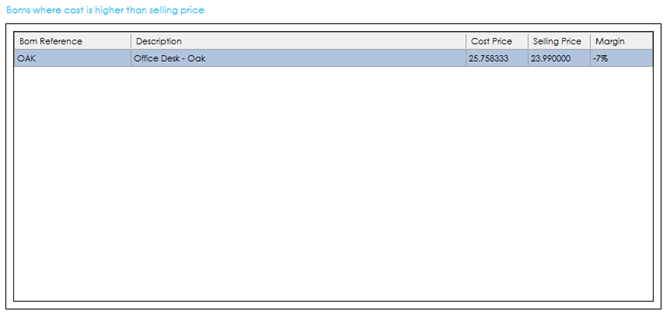
The grid provides you with the following information:
BOM Reference: The BOM item stock code.
Description: The description of the item.
Cost Price: The calculated unit cost price from the latest costing session.
Selling Price: The selling price defined on the BOM item stock record.
Margin: The loss that would be made, based on the sales and cost price expressed as a percentage.
Double click on the dashboard to drill down.
Once the dashboard has been drilled into, you are presented with the same information, but can search for specific items.
Use the Back button in the bottom left of the screen, to return to the Dashboard screen.
Suggested selling price is higher than selling price
This dashboard shows you the BOMs that have a calculated suggested selling price that is higher than the selling price defined on the associated items stock record.
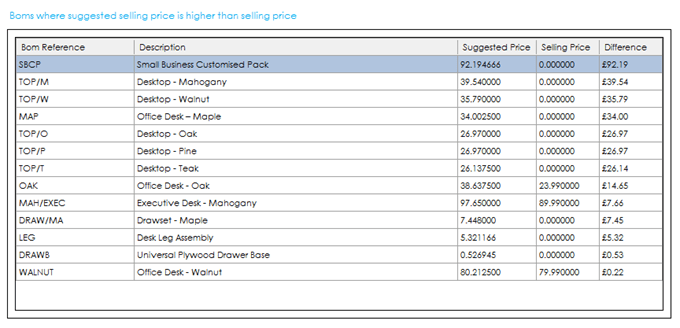
The grid displayed includes the following information:
BOM Reference: The BOM item stock code.
Description: The description of the item.
Suggested Price: The calculated suggested selling price from the latest costing session.
Selling Price: The selling price defined on the BOM item stock record.
Difference: The value difference between those figures expressed as a currency value.
Double click on the dashboard to drill down.
Once the dashboard has been drilled into, you are presented with the same information, but can search for specific items.
Use the Back button in the bottom left of the screen, to return to the Dashboard screen.
Build Volume by week
This dashboard shows you the volume of items manufactured via the BOM Build process, by week, in units manufactured.
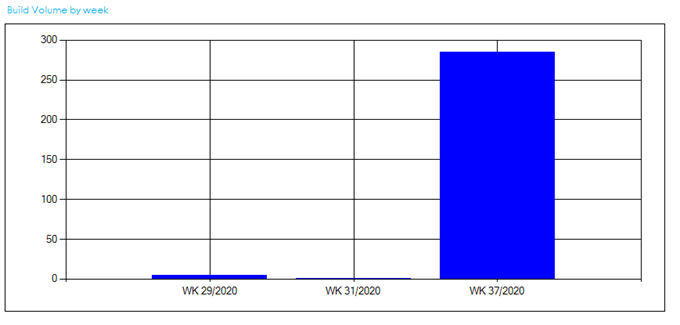
Double click on the dashboard to drill down.
Once the dashboard has been drilled into, click on any of the week columns in the chart to get a breakdown of the builds carried out in the data grid on the right-hand side.
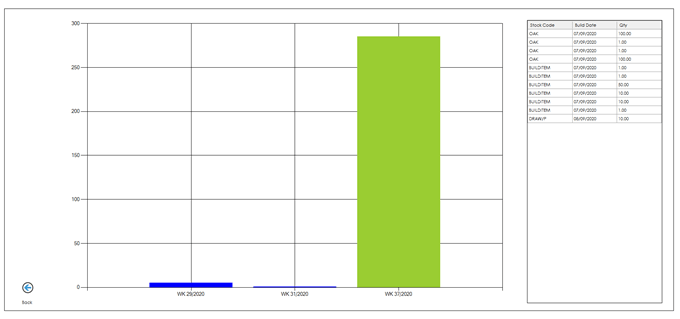
Use the Back button in the bottom left of the screen to return to the Dashboard screen.
Build Value by week
This dashboard shows you the value of items manufactured via the BOM Build process, by week, in currency value.
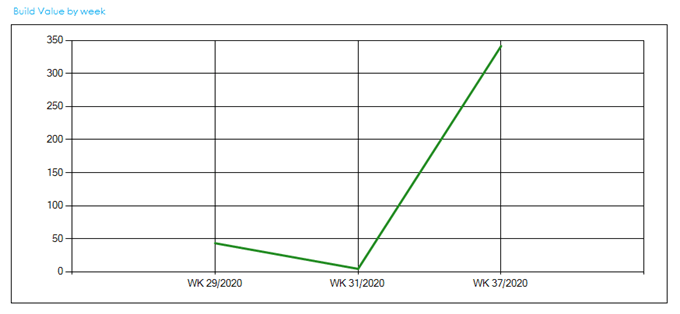
Double click on the dashboard to drill down.
Once the dashboard has been drilled into, click on any of the week data points in the chart to get a breakdown of the builds carried out in the data grid on the right-hand side.
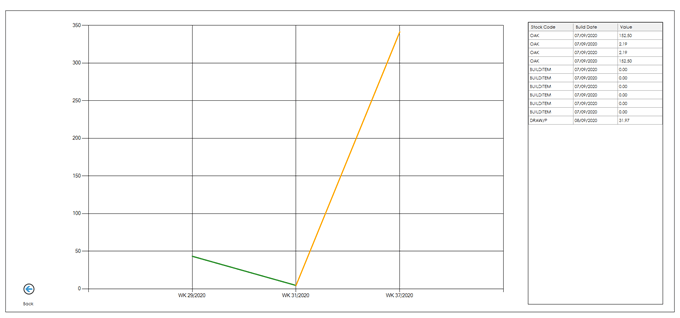
Use the Back button in the bottom left of the screen to return to the Dashboard screen.
See also
Related
Other tasks