Costing Tab
The costing screen is broken down into two sections. The top half of the screen details the latest costs calculated when the bill of material was last costed. The bottom half shows the historical costing sessions and the breakdown of the costs at the time of each costing session.
For information on how the costs for a BOM are calculated, go to the Cost Calculations section.
Latest Costs
The latest costs grid shows the breakdown of costs from the latest cost session. Bill of material costs are broken down in to 8 different categories, along with a final unit cost total.
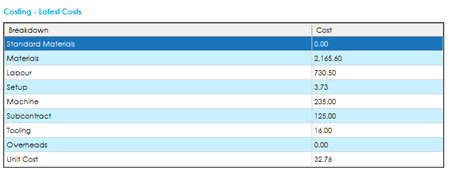
Standard Materials: The value shown here is the material cost calculated based on the ‘Standard Material Cost’ field defined against each component stock record. Assuming the BOM did not change, this value would only fluctuate if you updated a standard cost against a component item.
Materials: The value shown here is the material cost calculated based on the ‘Last Cost Price’. This value will fluctuate over time as supplier receipt costs fluctuate.
Note: This value may include labour, machine, setup, subcontract, and tooling costs from sub-assembly BOMs, depending on whether the system is set to ‘roll up costs’ or not. More information on this can be found in the Cost Calculations section.
Labour: The value shown here is the calculated labour cost to process the operations.
Note: This value may include labour costs from sub-assembly BOMs, depending on whether the system is set to ‘roll up costs’ or not. More information on this can be found in the Cost Calculations section.
Setup: The value shown here is the calculated setup cost to process the operations.
Note: This value may include setup costs from sub-assembly BOMs, depending on whether the system is set to ‘roll up costs’ or not. More information on this can be found in the Cost Calculations section.
Machine: The value shown here is the calculated machine cost to process the operations.
Note: This value may include machine costs from sub-assembly BOMs, depending on whether the system is set to ‘roll up costs’ or not. More information on this can be found in the Cost Calculations section.
Subcontract: The value shown here is the calculated subcontract cost based on the supplier subcontract values.
Note: This value may include subcontract costs from sub-assembly BOMs, depending on whether the system is set to ‘roll up costs’ or not. More information on this can be found in the Cost Calculations section.
Tooling: The value shown here is the calculated tooling cost based on the tooling quantity and cost values.
Note: This value may include tooling costs from sub-assembly BOMs, depending on whether the system is set to ‘roll up costs’ or not. More information on this can be found in the Cost Calculations section.
Overheads: The value shown here is the calculated overhead cost based on the relevant material/operational costs and the overhead recovery percentages defined on the BOM and any sub-assemblies.
Unit Cost: This value shows the calculated unit cost, per 1, of the finished item. It is calculated based on the total cost from each of the categories defined above, divided by the costing quantity.
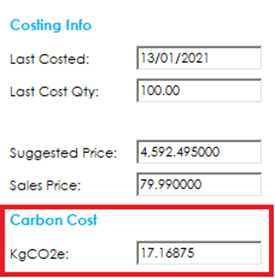
Costing Info
The costing info section of the screen shows information relevant to the latest costs grid.
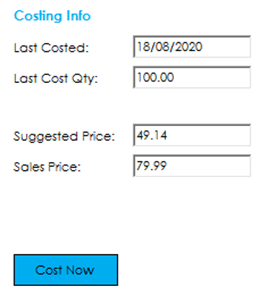
Last Costed: The date the BOM was last costed.
Last Cost Qty: The quantity that was used when the BOM was last costed.
Suggested Price: The suggested selling price based on the unit cost and the mark-up specified on the main details.
Sales Price: The current default sales price defined on the stock record.
Carbon Emissions: If the system is enabled to capture carbon emissions, an additional ‘KgCO2e’ field will be visible. This shows the calculated Carbon Emissions if you were to manufacture the quantity costed.
Cost Now
The Cost Now button will calculate a BOM cost. If the values have changed since the BOM was last costed, you will see the ‘Latest Costs’ grid update, along with the Costing Info.
An additional row will be added to the costing history grid.
For more information on how a BOM is costed, please refer to the Cost Calculations section.
Costing History
The costing history grid displays the results of the previous costing sessions. Cost values displayed, are per the latest cost grid, and show the values that would have been displayed in the latest cost’s grids, at the time they were costed.
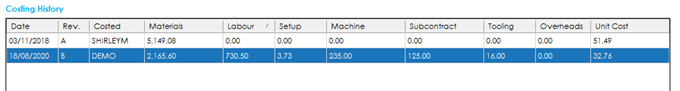
Additional information displayed, includes the date it was costed, the revision number at the time of the costing, and who carried out the costing session.
Carbon Emissions: If the system is enabled to capture carbon emissions, an additional ‘KgCO2e’ column will be visible. This shows the calculated carbon emissions for the quantity costed at the time.

View Cost Breakdown
You can view a detailed cost breakdown for any of the historical costing sessions.
To access the cost breakdown screen, you can either highlight the relevant record you wish to view the breakdown for in the costing history grid (single click any cell) and press the View Cost Breakdown button, or you can double click on the relevant record.
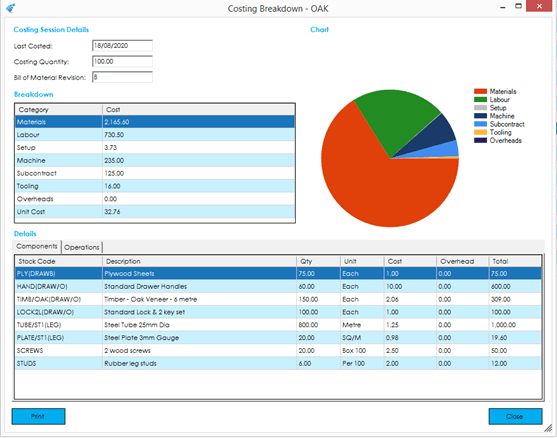
The costing breakdown screen shows the costing session info and the cost category breakdown at the top of the screen, along with visualising the category breakdown as a pie chart.
Beneath, there are 2 tabs available that give you the detailed information of how those costs were calculated.
Carbon Emissions: If the system is enabled to capture carbon emissions, an additional ‘KgCO2e’ field will be visible, along with an additional column in the components and operations tabs.
Components: The components detail grid shows the components and sub-assembly components that have been calculated in the material cost category.
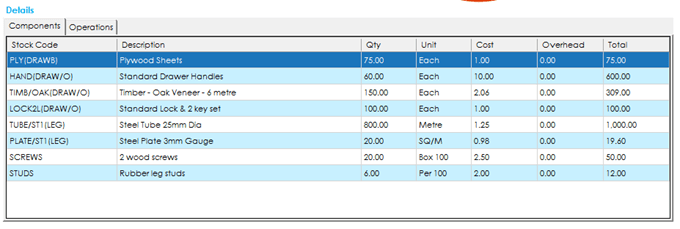
If one of the components listed, is from a sub-assembly, it will detail the sub-assembly BOM reference that the item belongs to (in brackets), after the component stock code.
The details grid shows the description, the quantity that were costed for based on the top-level costing quantity, the unit of measure that item uses on the BOM, the unit cost price at the time the costing session took place, the calculated overhead value based on the overhead recovery rates at the time the costing session took place, and the total cost for that item.
Operations: The operations detail grid shows the operations and sub-assembly operation that have been calculated in the operational process costs (and material costs depending on the roll-up costs setting).
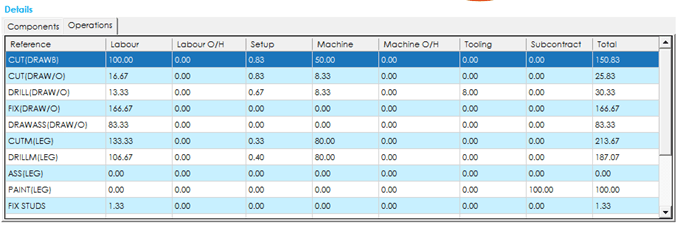
As per the components grid, if one of the operations listed is from a sub-assembly, it will detail the sub-assembly BOM reference that the item belongs to (in brackets), after the component stock code.
The details grid shows the calculated cost for each operational process category at the time the cost session took place, along with the overhead calculated cost for each, as well.
See also
Related
Other tasks