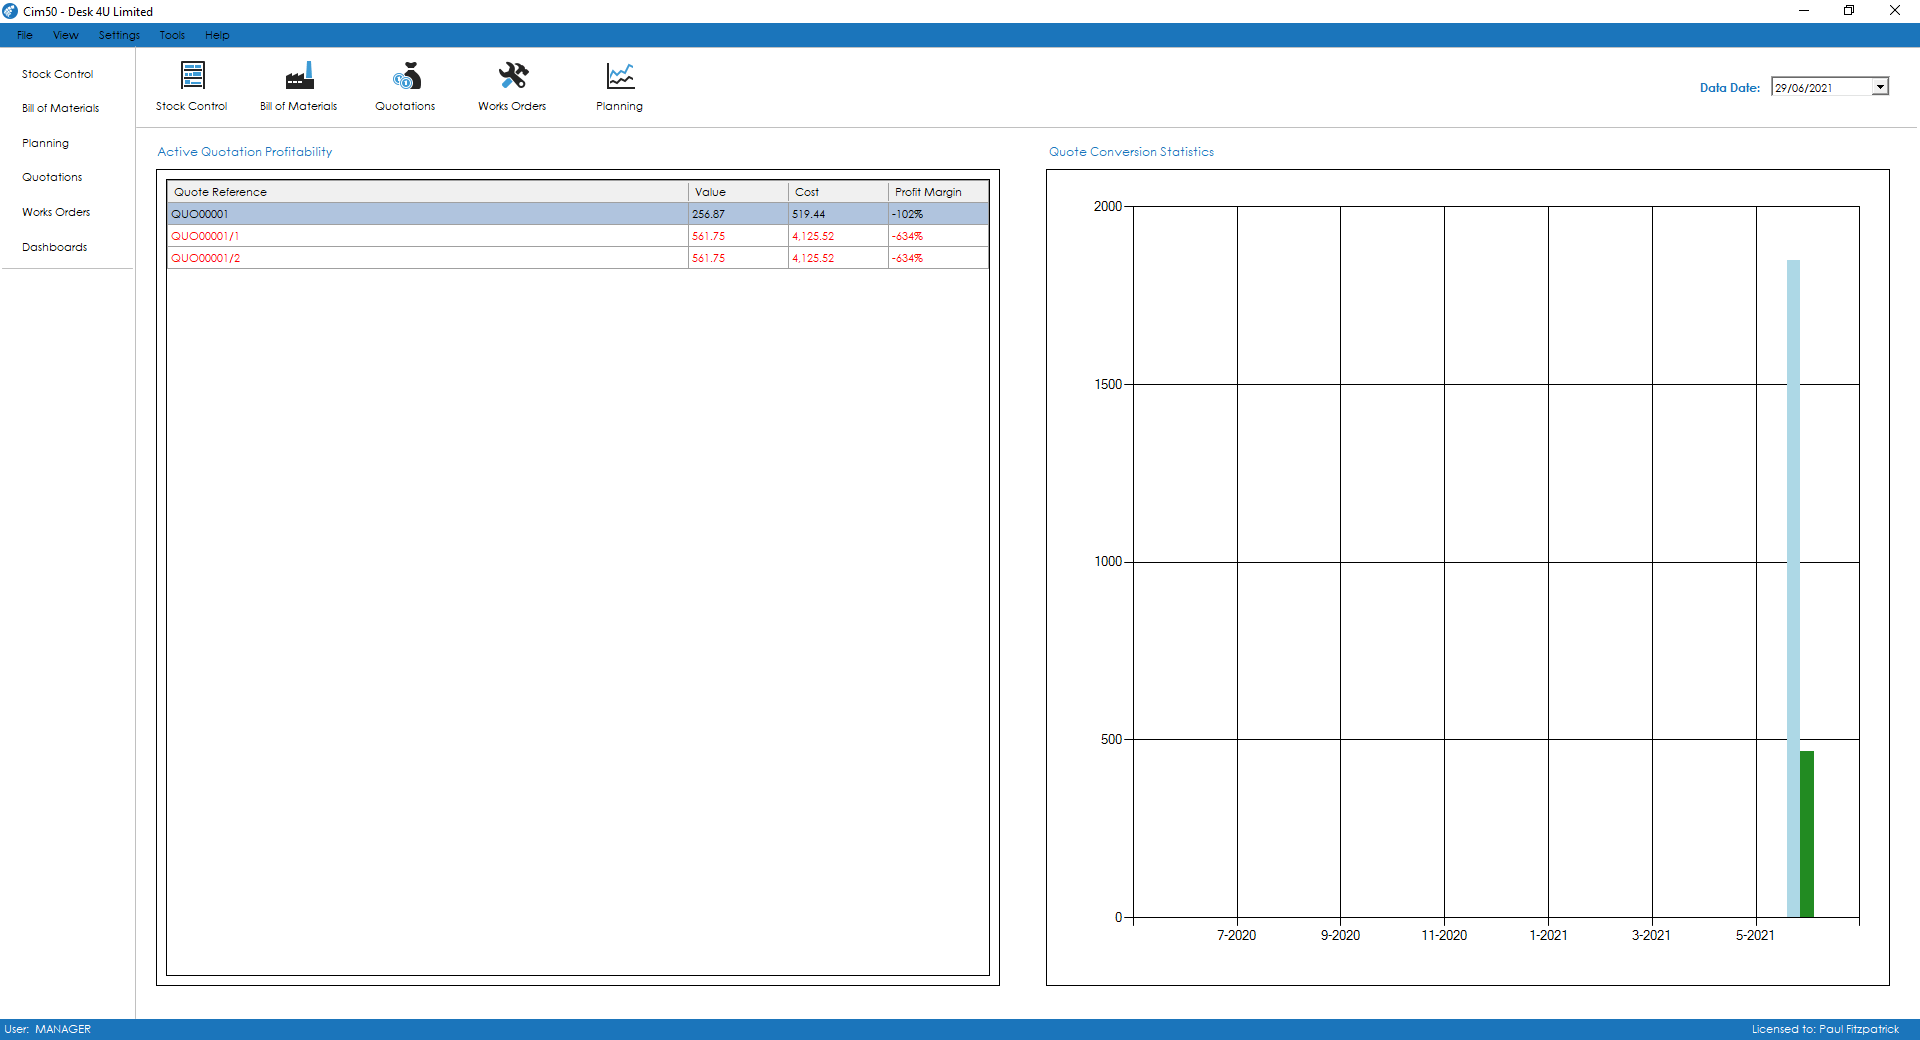
Dashboards
Dashboards can be accessed from the feature on the left-hand menu of Cim50 and provide key performance indicators across the Cim50 Modules.
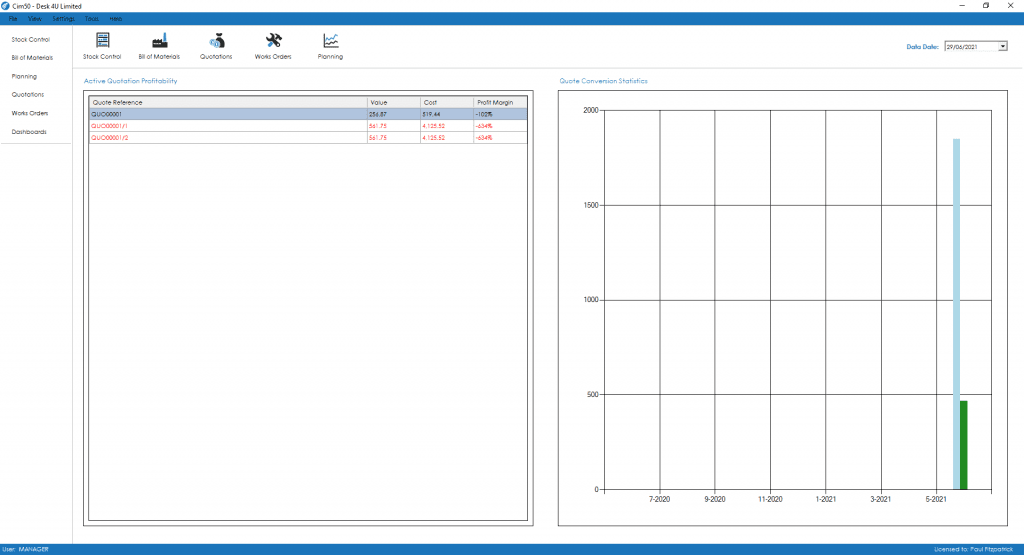
There are 2 dashboards available for Quotations. Details on each dashboard can be found below.
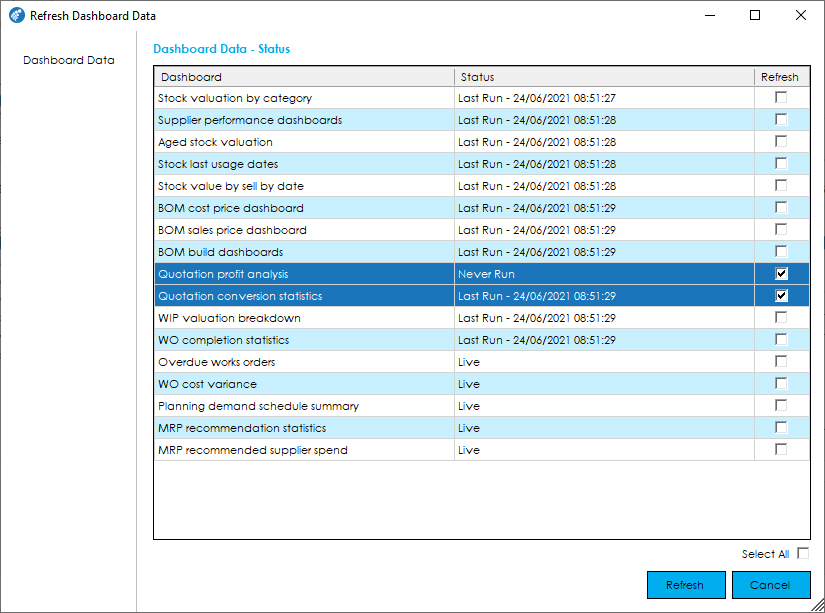
To provide efficiency in the Dashboard functionality, the Dashboard data is refreshed nightly by the CIMi service running on the server during the Check Data routine. You can also manually refresh data at any time by going to File > Maintenance > Refresh Dashboard Data, selecting all Dashboards or those required.
Active Quotation Profitability
This dashboard shows you a list of “live” quotations with the profitability based on a comparison of the calculated cost price vs. sales price.
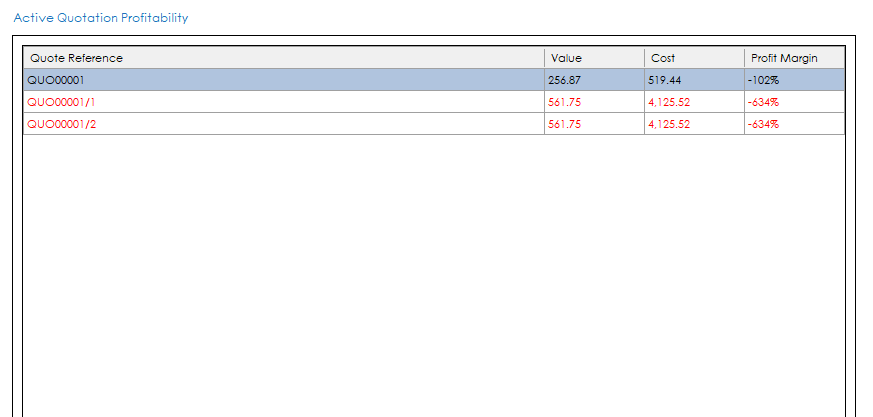
Double click on the relevant quotation in the dashboard to view it.
Quote Conversion Statistics
This dashboard shows you the number of quotations raised, won and lost each month in the last 12 months. There are 3 individual bars per month, with raised showing in light blue, won in green and lost in red.
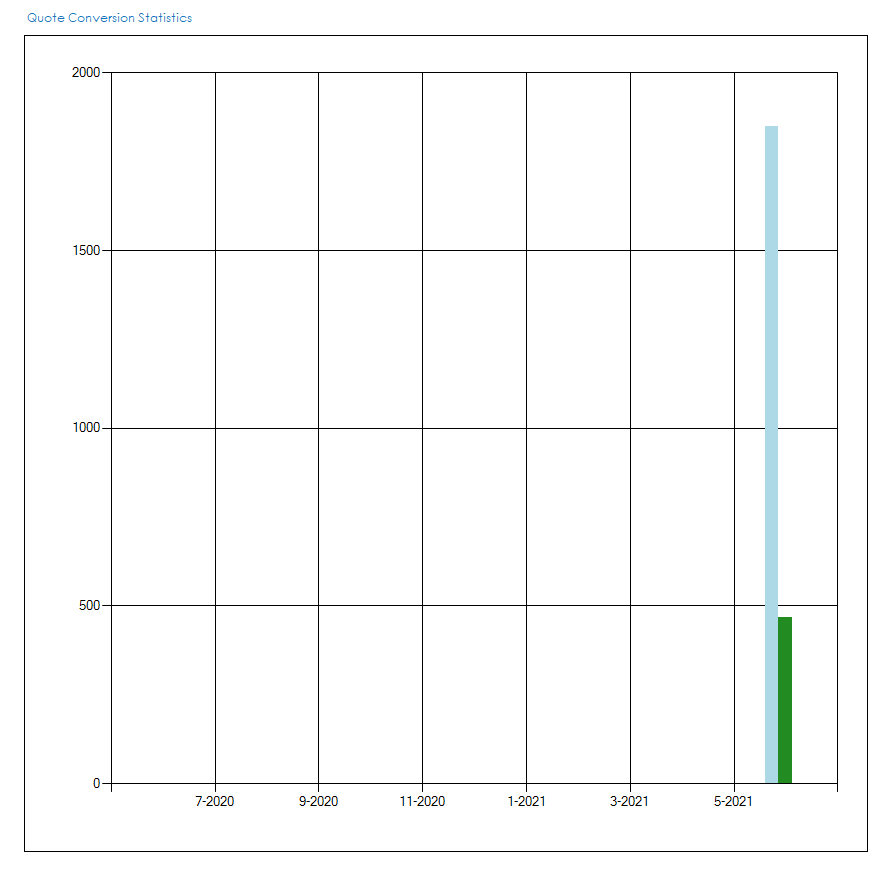
Double click on the dashboard to drill down.
Once the dashboard has been drilled into, click on any of the month bars in the chart to get a breakdown of quotes created/won/lost that month in the data grid on the right hand side.
See also
Related
Other tasks