Dashboards
Dashboards can be accessed from the feature on the left-hand menu of Cim50 and provide key performance indicators across the Cim50 Modules.
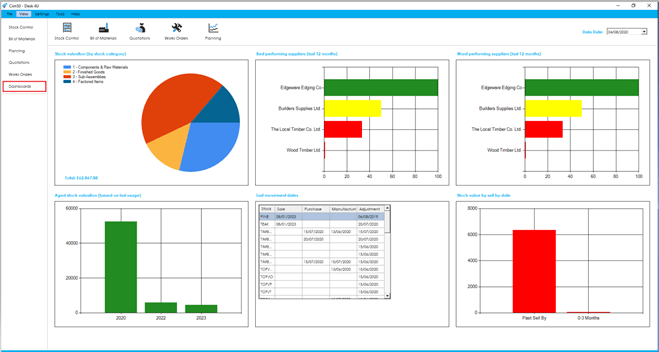
There are 6 dashboards available for Stock Control. Details on each dashboard can be found below.
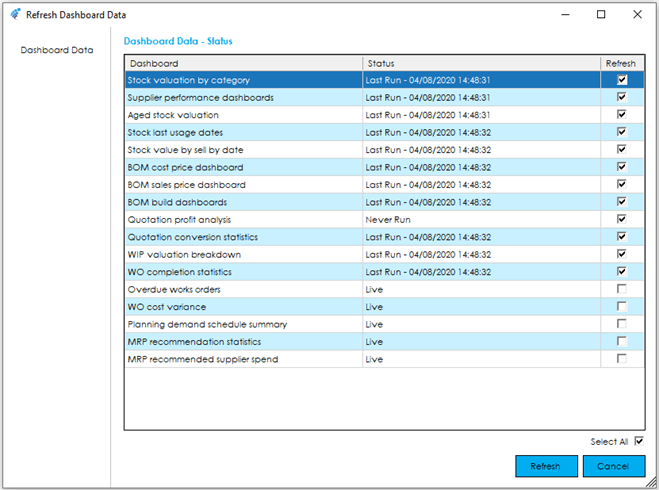
To provide efficiency in the Dashboard functionality, the Dashboard data is refreshed nightly by the CIMi service running on the server during the Check Data routine. You can also manually refresh data at any time by going to File > Maintenance > Refresh Dashboard Data, selecting all Dashboards or those required.
The Dashboards included for Stock Control are as follows:
Stock valuation
This dashboard gives you a breakdown of your stock valuation by stock category. The total stock valuation is displayed in the bottom left.
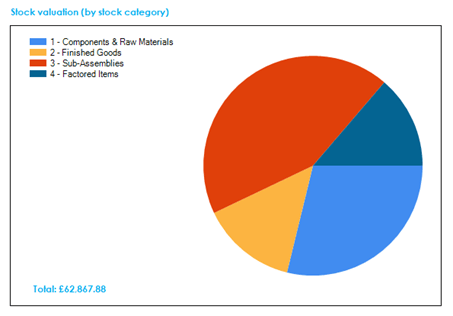
Double click on the dashboard to drill down.
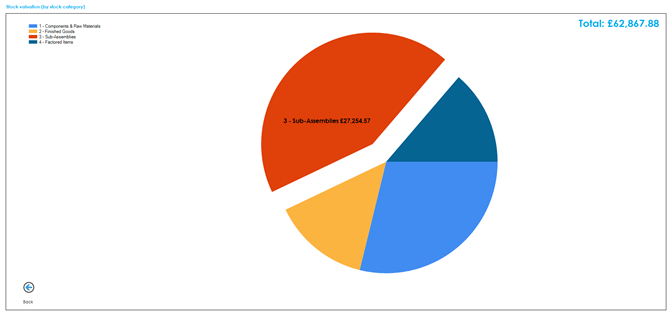
Once the dashboard has been drilled into, click on any segment in the pie chart to get the value of stock for that category.
Use the Back button in the bottom left of the screen, to return to the ‘Dashboard’ screen.
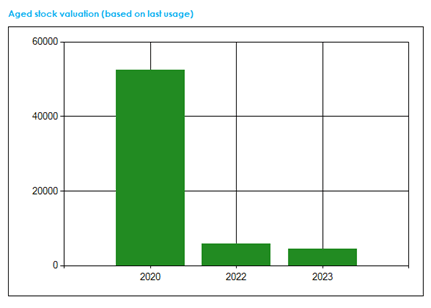
Aged stock valuation
This dashboard shows you the value of stock based on its last usage date. Usage is classed as a ‘MI’, ‘MO’, ‘GI’, ‘GO’, ‘AI’ or ‘AO’ stock transaction types.
Double click on the dashboard to drill down.
Once the dashboard has been drilled into, click on any of the year bars in the chart to get the breakdown of the stock value for stock that has not been used since that year.
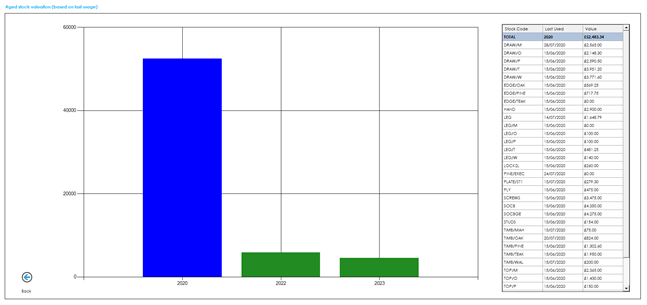
Use the Back button in the bottom left of the screen to return to the Dashboard screen.
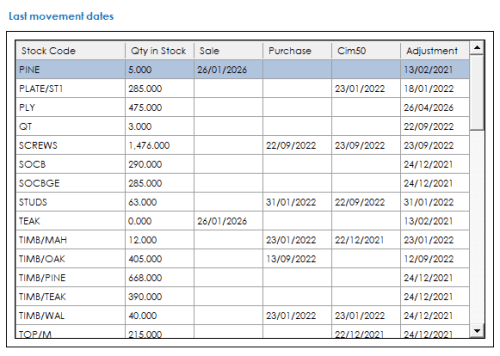
Last Movement Dates
This dashboard shows you the last movement dates for each transaction type, along with the quantity in stock at the time the dashboard snapshot was taken. Items are sorted based on a ranking score, with the score being calculated based on the total number of days elapsed since the last movement, for each transaction type.
Double click on the dashboard to drill down.
Once the dashboard has been drilled into, you can take advantage of the search functionality to find any items you are looking for.
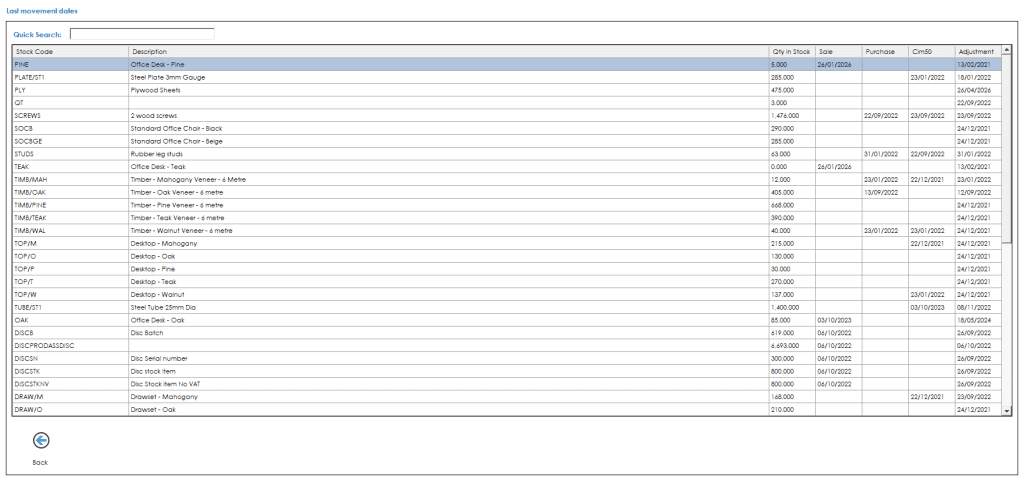
Use the Back button in the bottom left of the screen to return to the Dashboard screen.
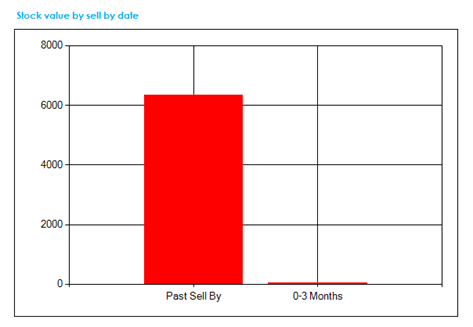
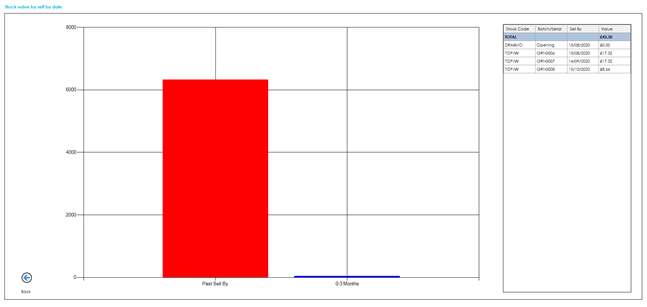
Stock value by sell by date
This dashboard shows you the value of traceable stock based on its sell by date. The value is broken down into stock that is past sell by, and then into quarterly buckets.
Double click on the dashboard to drill down.
Once the dashboard has been drilled into, click on any of the bars in the chart to get the breakdown of the traceable stock value for bucket.
Use the Back button in the bottom left of the screen to return to the Dashboard screen.
See also
Related
Other tasks