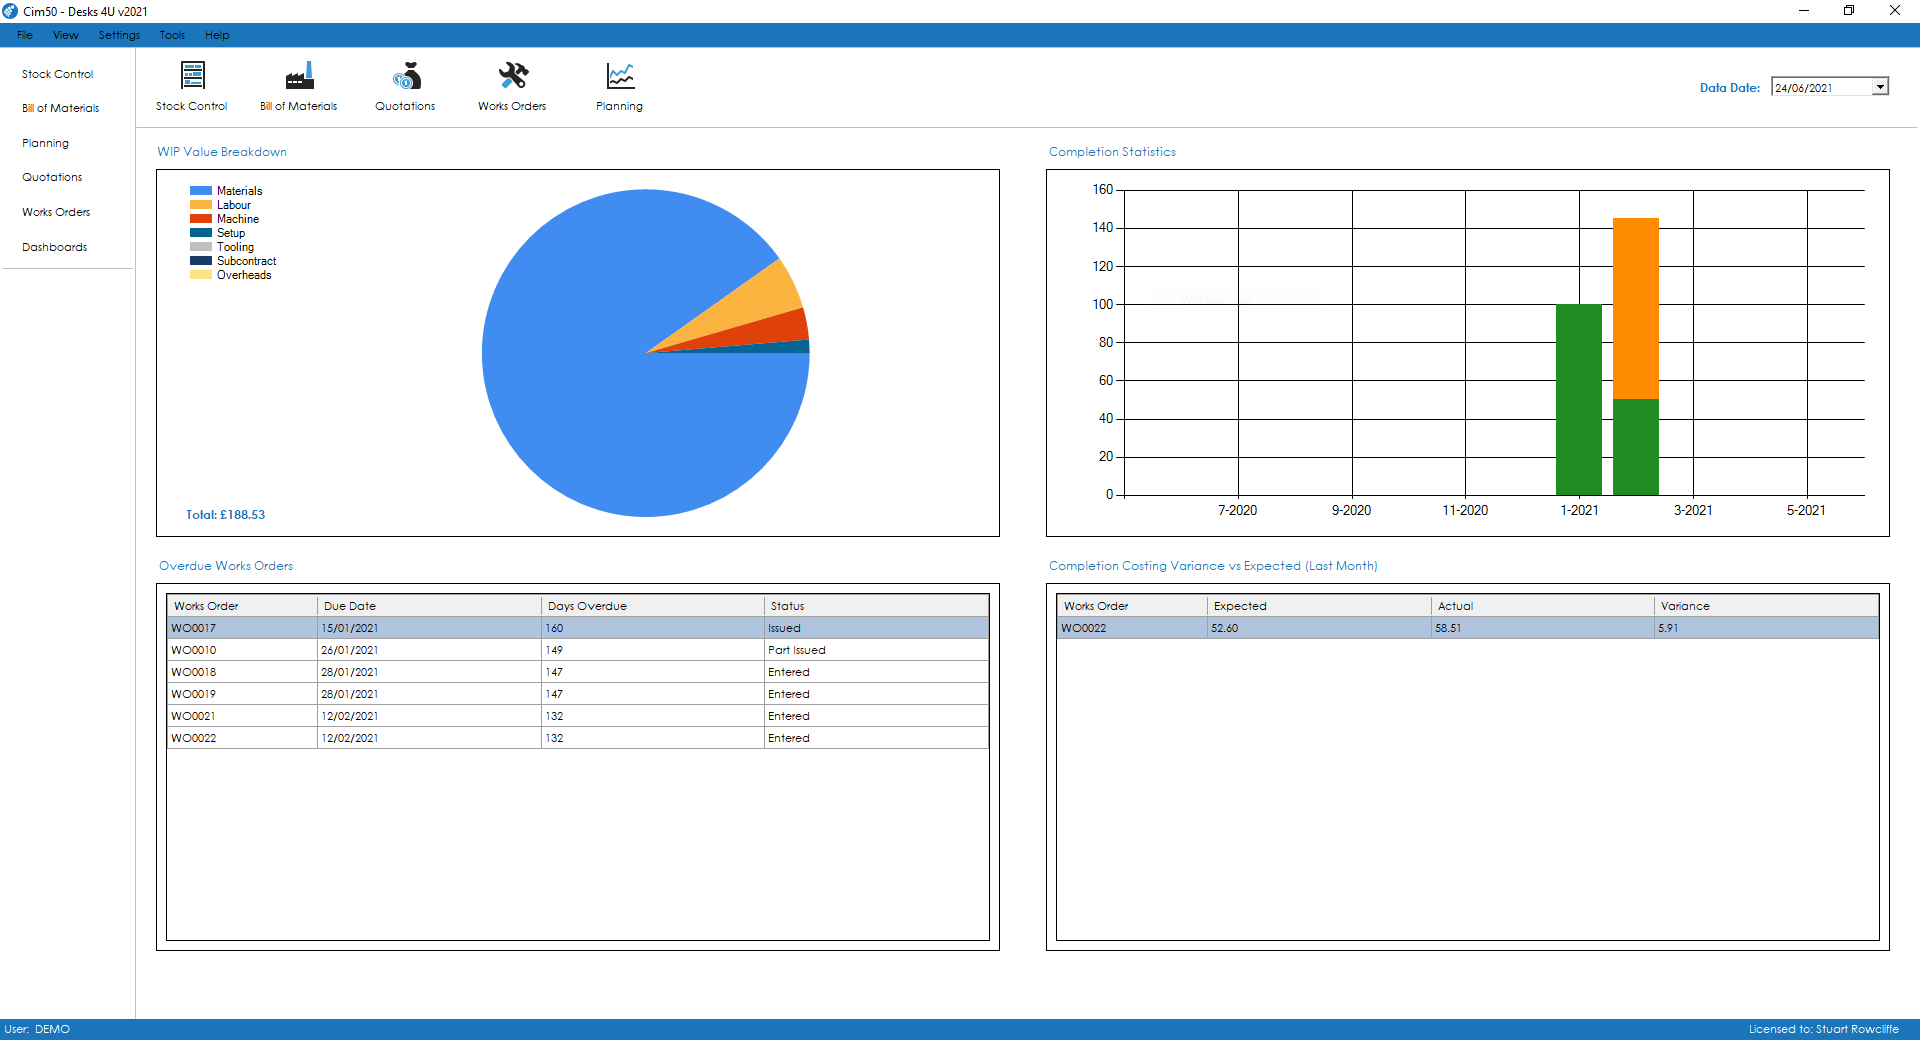
Dashboards
Dashboards can be accessed from the feature on the left-hand menu of Cim50 and provide key performance indicators across the Cim50 Modules.

There are 4 dashboards available for Works Orders. Details on each dashboard can be found below.
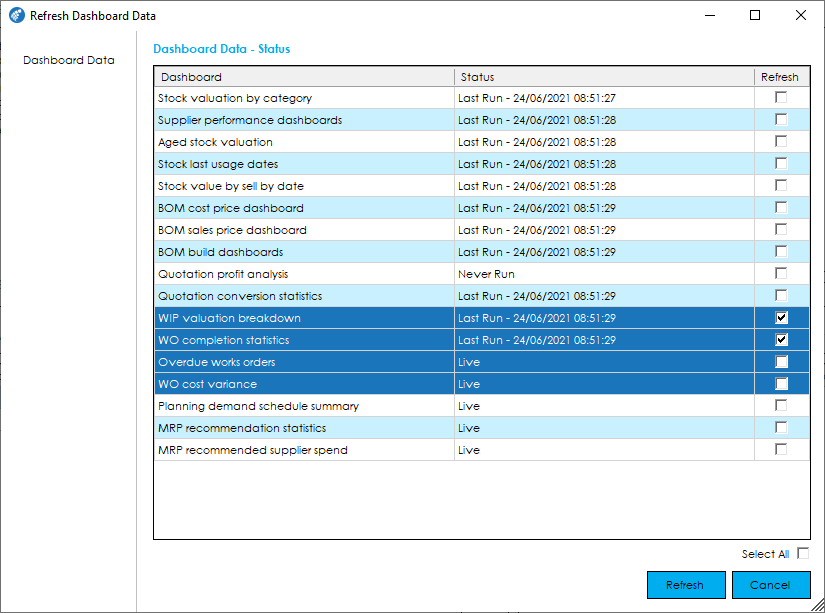
To provide efficiency in the Dashboard functionality, the Dashboard data is refreshed nightly by the CIMi service running on the server during the Check Data routine. You can also manually refresh data at any time by going to File > Maintenance > Refresh Dashboard Data, selecting all Dashboards or those required.
The Dashboards included for Works Orders are as follows:
WIP Value Breakdown
This dashboard gives you a breakdown of your WIP valuation by cost type. The total WIP value is displayed in the bottom left.
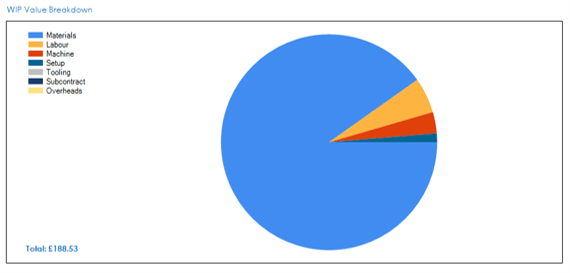
You can Double click on the dashboard to drill down.
Once the dashboard has been drilled into, click on any segment in the pie chart to get the WIP value for that cost type.
Completion Statistics
This dashboard shows you the quantity of finished goods from works orders that were completed on time (Green), completed but overdue (Orange) and scrapped (Red) per month over the last 12 months.
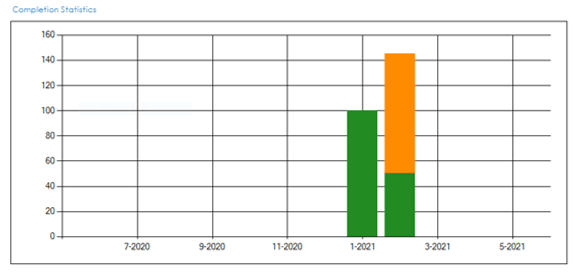
Double click on the dashboard to drill down.
Once the dashboard has been drilled into, click on any of the monthly bars in the chart to get a breakdown of works order completions for that month in the data grid on the right hand side.
Overdue Works Orders
This dashboard shows you a list of overdue works orders. This dashboard is live, and is not part of the nightly snapshot of data take by CIMi.
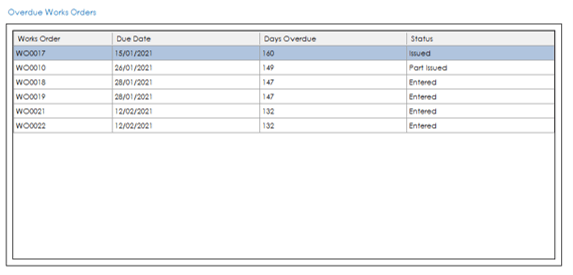
Double click on the works order in the dashboard to view it.
Completion Cost Variance vs Expected (Last Month)
This dashboard shows you completed works orders that have been completed in the last month where the actual cost price is higher or lower than the expected cost price.
A 10% tolerance is used by the dashboard to determine whether a works order should be included. This means a works order will only be displayed if the actual cost is more than 10% higher than expected, or more than 10% lower than expected.
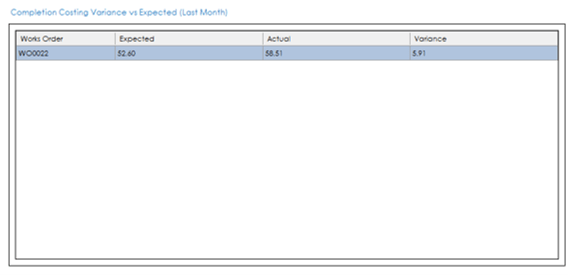
Double click on the works order in the dashboard to view it.
See also
Related
Other tasks