The statistics screen gives you access to various Key Performance Indicators (KPIs) relating to the current stock item. There are 4 radio buttons at the top of the screen, allowing you to view specific statistics based on the Item Type and relevant business activity.
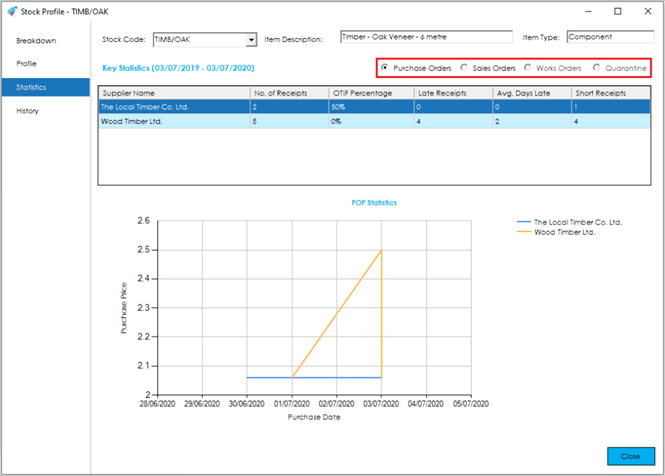
Purchase Orders
Shown in the screen above, it is split in to two parts. The top of the screen shows a data grid displaying each supplier you have purchased the current stock item from in the last 12 months. Details available in this grid are the supplier name, number of orders placed with the supplier, how many of those orders were received on time and in full (OTIF), expressed as a percentage, the number of orders that were received late, and on average how late they were, along with the number of receipts that were not for the total order quantity.
At the bottom of the screen is a line graph displaying the purchase price trend per supplier in the last 12 months.
Sales Orders
Similarly, this screen is split into two parts. The top of the screen shows a data grid displaying each customer that has purchased the current stock item from you in the last 12 months. Details available in this grid are the customer name, number of orders placed, how many were shipped on time and in full (OTIF), expressed as a percentage, along with the number of late shipments, average days those shipments were late, and lastly, how many orders were not shipped in full.
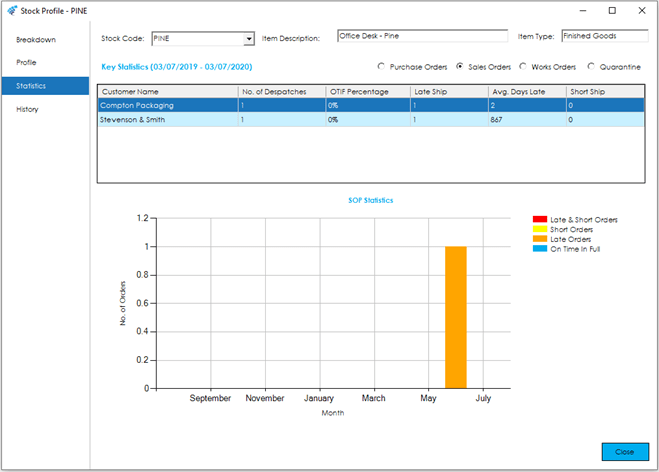
At the bottom of the screen is a stacked bar graph showing a breakdown of order fulfilment. Light Blue signifies orders that were shipped on time and in full. Orange represents orders that were shipped in full but were late. Yellow represents orders which were shipped on time but were not shipped in full, and Red represents orders that were shipped late and were not shipped in full.
Works Orders
This screen shows an overview of manufacturing performance for the current item in the last 12 months.
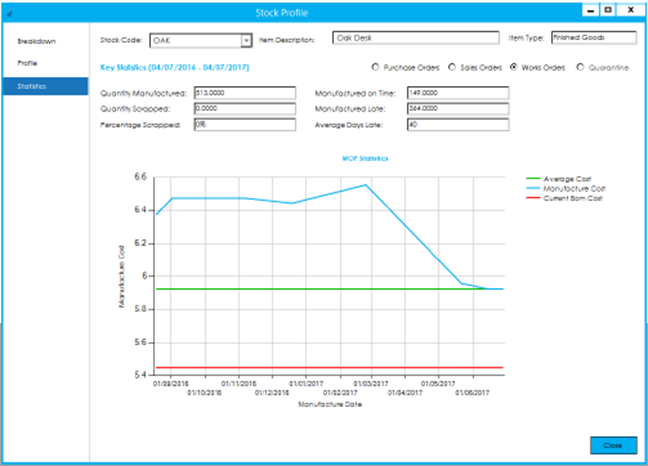
The Screen is also broken down into two areas. The top of the screen contains the following data fields with key data regarding the Stock Record selected, these are as follows:
Quantity Manufactured: Total quantity manufactured in the last 12 months.
Quantity Scrapped: Total quantity scrapped in the last 12 months.
Percentage Scrapped: Scrap quantity expressed as a percentage of the total manufactured quantity.
Manufactured on Time: The quantity that completed manufacture on or before the Works Order Due Date.
Manufactured Late: The quantity that completed manufacture after the Works Order Due Date.
Average Days Late: The average number of days those late items were past the Works Order Due Date.
At the bottom of the screen is a line graph displaying 3 key indicators. The Red line represents the current bill of material cost. The Blue line represents the actual cost of each works order manufactured in the last 12 months, and the Green line represents the average cost price on the stock record.
You can hover over any point on the blue line to see the relevant Works Order Number.
Quarantine
This screen shows the breakdown of all items that passed through quarantine in the last 12 months.
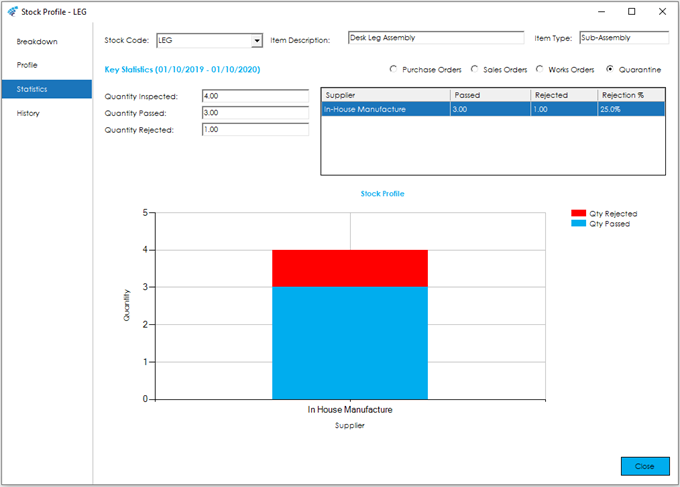
A data grid details the information by supplier or In-house Manufacture, and a stacked bar graph at the bottom, displays a graphical representation of the number of items passed/rejected per supplier or In-house Manufacture.
Further details regarding the data contained within screen are shown within Quarantine.